
Trong Sharepoint 2010 sử dụng status list để báo cáo kinh doanh, nhìn vào báo cáo có thề biết được tình hình kinh doanh có đạt mục tiêu hay không? Trong Sharepoint 2013 status list không còn sử dụng, thay vào đó sharepoint 2013 sử dụng Key Performance Indicators (KPIs) trong Excel service. Trong bài lab này sẽ hướng dẫn sử dụng KPIs tạo báo cáo kinh doanh.
Triển Khai Báo cáo Kinh Doanh:
Trong bài LAB này được thực hiện theo các bước sau:
- Tạo column
- Tạo View
- Export View to Ecxel
- Create Pivot table
- Tạo mục tiêu kinh doanh
- Create Key Performance Indicators
- Lưu báo cáo vào sharepoint
- Edit page (hiển thị báo cáo)
- Kiểm Tra
Sau khi hoàn thành bài lab, các bạn sẽ biết cách sử dụng Key Performance Indicators KPIs trong báo cáo kinh doanh
Thực Hiện Báo cáo Kinh Doanh:
B1: Tạo Column.
Trở lại site internal.nhatnghe.local\QLTK chọn Phiếu xuất, vào tab list\List setting
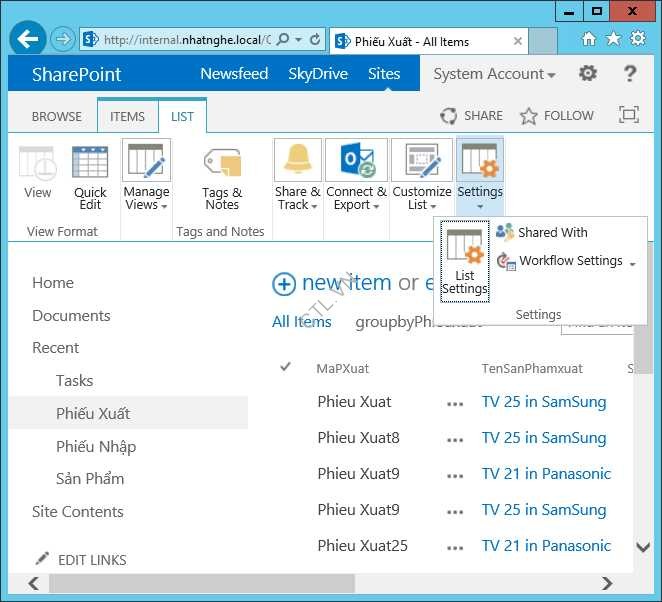
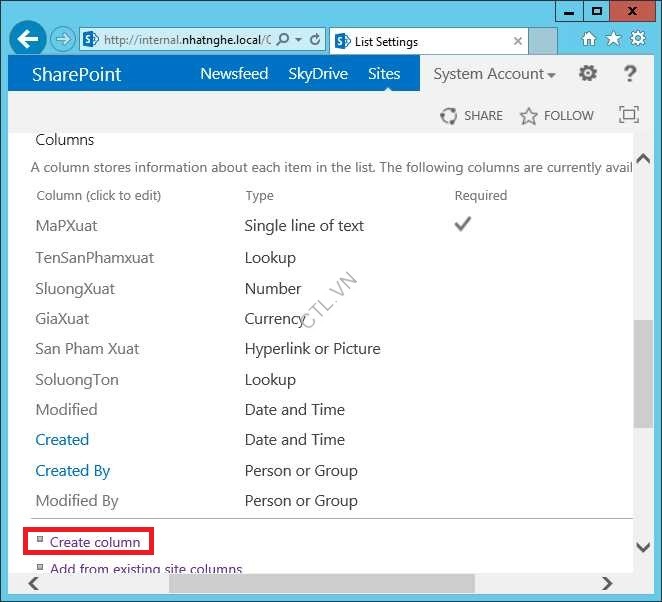
Trong phần columns chọn create Column
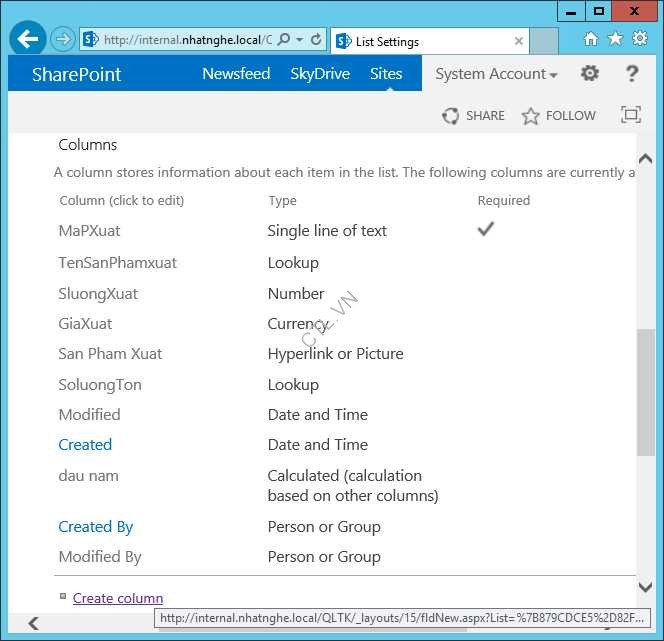
Column Name: Đầu Năm chọn kiểu dữ liệu Calculated

Trong phần Formular: Date(year([Created]),1,1), chọn option Date and Time Ok

Trong phần column tiếp tục chọn Create column
Column Name: Cuoi Nam, kiểu dữ liệu Calculated
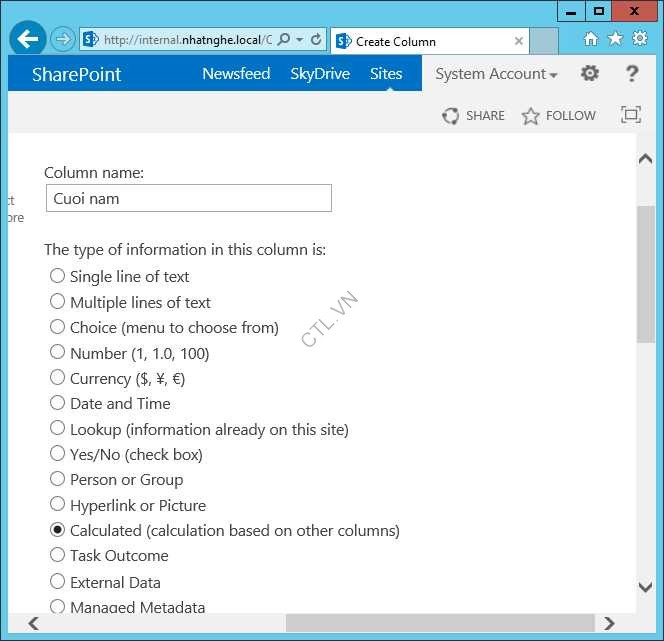
Trong phần Formula: Date(year([Create]),12,31), chọn option date and Time và date Only ok

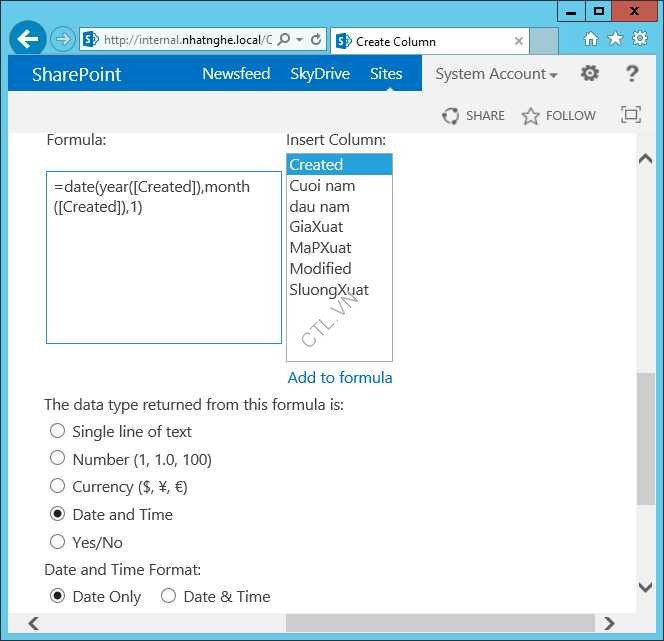
Tiếp tục tạo Column Dau thang, kiểu dữ liệu calculated

Formula: Date(year([Created]),month([Created]),1), chọn option Date and Time và Date only Ok
Tiếp tục tạo Column Cuoi thang, kiểu dữ liệu: calculated

Formula: Date(year([Created]),month([Created])+1,1)-1, Chọn option date and time và Date Only Ok

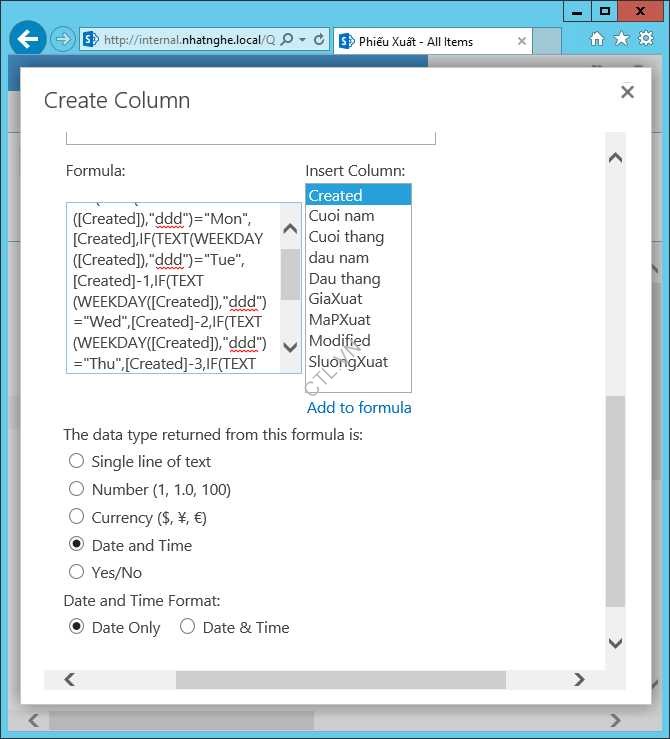
Tiếp tục tạo Column Dau Tuan, Kiểu dữ liệu Calculated

Trong phần formula: IF(TEXT(WEEKDAY([Created]),”ddd”)=”Mon”,[Created],IF(TEXT(WEEKDAY([Created]),”ddd”)=”Tue”,[Created]-1,IF(TEXT(WEEKDAY([Created]),”ddd”)=”Wed”,[Created]-2, IF(TEXT(WEEKDAY([Created]),”ddd”)=”Thu”,[Created]-3, IF(TEXT(WEEKDAY([Created]),”ddd”)=”Fri”,[Created]-4, IF(TEXT(WEEKDAY([Created]),”ddd”)=”Sat”,[Created]-5,[Created]-6))))))
Chọn option date and time và date only Ok
Tương tự tạo column cuối tuần, kiểu dữ liệu Calculated

Formula: =IF(TEXT(WEEKDAY([Created]),”ddd”)=”Mon”,[Created]+6,IF(TEXT(WEEKDAY([Created]),”ddd”)=”Tue”,[Created]+5,IF(TEXT(WEEKDAY([Created]),”ddd”)=”Wed”,[Created]+4,IF(TEXT(WEEKDAY([Created]),”ddd”)=”Thu”,[Created]+3,IF(TEXT(WEEKDAY([Created]),”ddd”)=”Fri”,[Created]+2,IF(TEXT(WEEKDAY([Created]),”ddd”)=”Sat”,[Created]+1,[Created]))))))
Chọn option date and time và date only Ok, Tạo column xong.

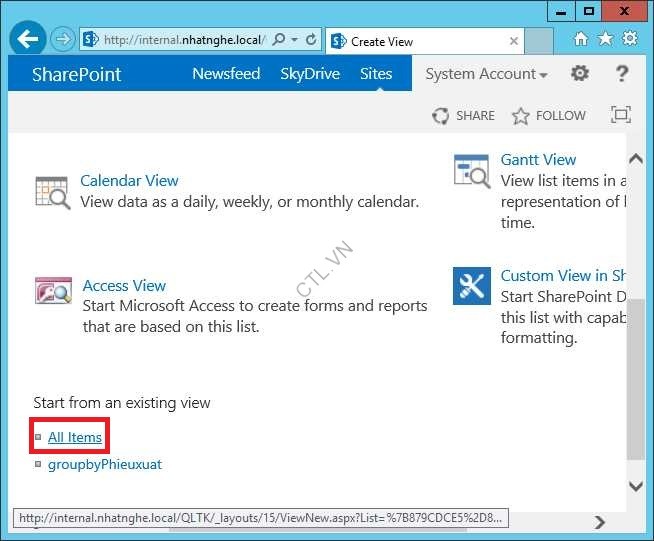
Trở về phiếu xuất chọn list Create View

Chọn All Items
View Name: ThongKePhieuXuatTrongNgay

Chọn các checkbox như trong hình

Trong phần Filter Chọn Create is equal to [today] Ok

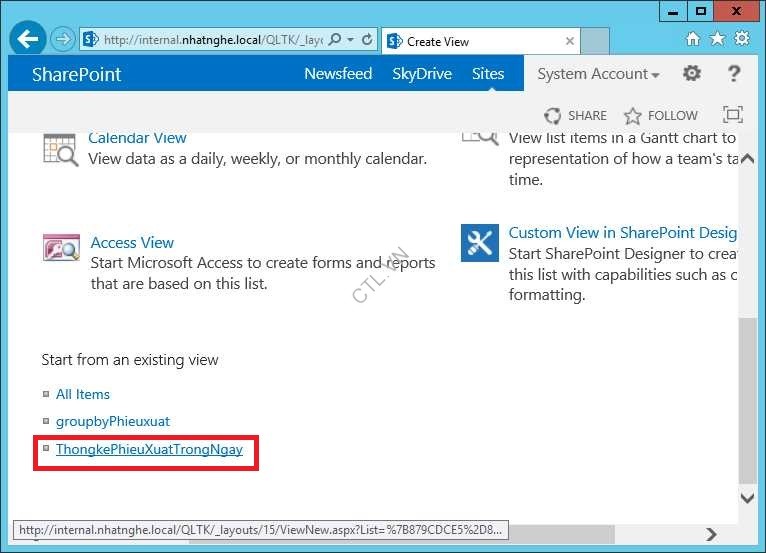
Tiếp tục chọn Create View

Chọn ThongKePhieuXuatTrongNgay
View Name: ThongKePhieuXuatTuanHienTai
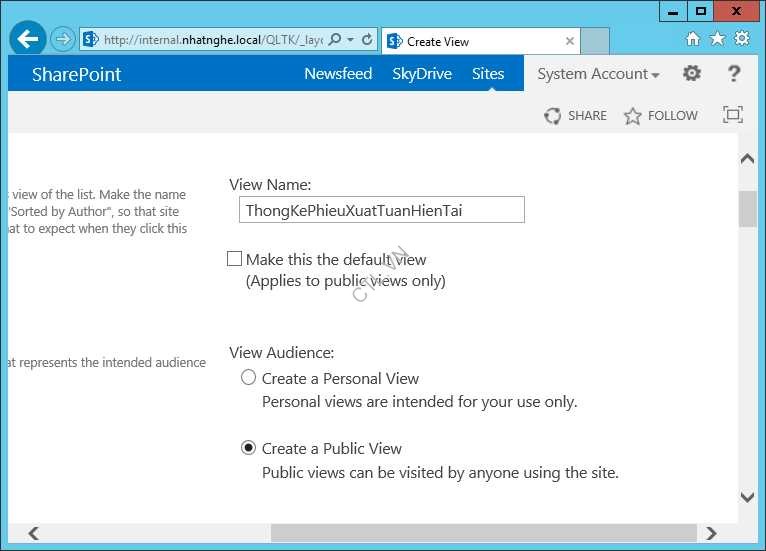
Chọn các option như trong hình

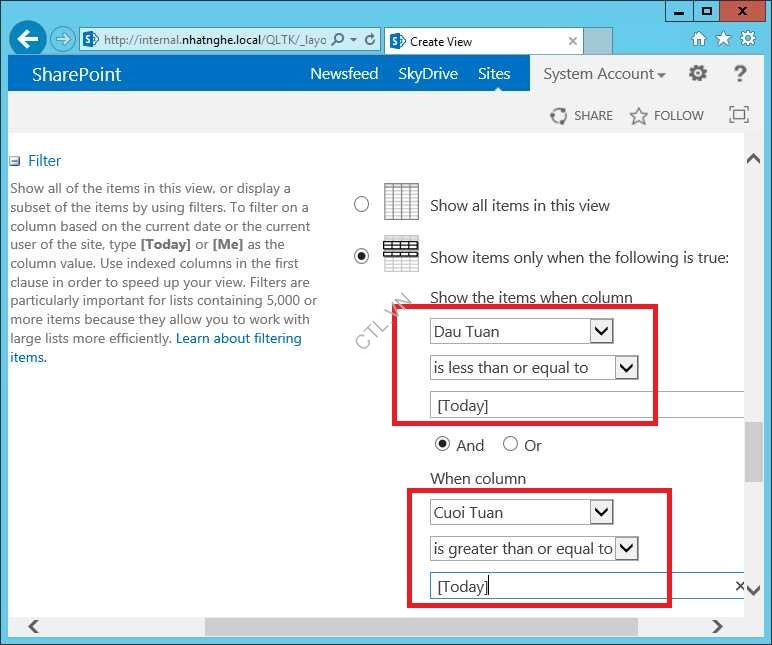
Trong phần Filter: Dau Tuan is less than or equal to [Today] and
Cuoi Tuan is greater than or equal to [Today] Ok
Tiếp tục tạo view ThongKePhieuXuattheoThang
Trong phần filter: Dau thang is less than or equal to [Today] and
Cuoi thang is greater than or equal to [Today] Ok

Tương tự tạo View thongkephieuxuatNamHienTai
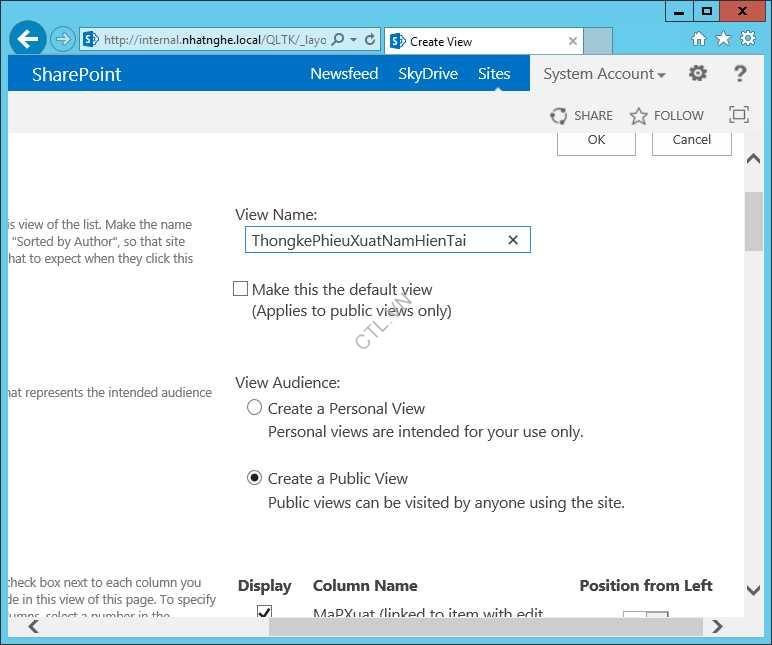
Chọn các checkbox như trong hình

Trong phần filter: Dau Nam is less than or equal to [Today] and
Cuoi nam is greater than or equal to [Today] Ok. Tạo View xong.

B3. Export to Excel
Chọn View ThongKePhieuXuatThangHienTai chọn List Export to Excel

Chọn Open

Chọn Enable.

Vào Excel chọn tab Data chọn Connections

Chọn properties

Chọn các checkbox như trong hình Ok Close

Chọn tab file save as chọn Computer Browse

Lưu file vào folder trên máy local, folder này đã trust location save

B4. Create Pivot table.
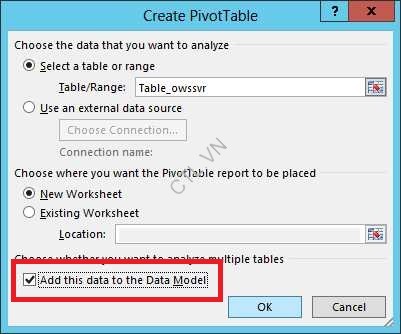
Trở lại tab Insert, đặt con trỏ vào vùng data, chọn Pivot Table

Check vào add this data to the data mode Ok
Màn hình Pivot table

Trong cửa sổ PivotTable Fields check vào Tensanphamxuat, SluongXuat,GiaXuat. Sẽ có kết quả như trong hình.

Phải chuột vào Sum of Giaxuat chọn value field Settings
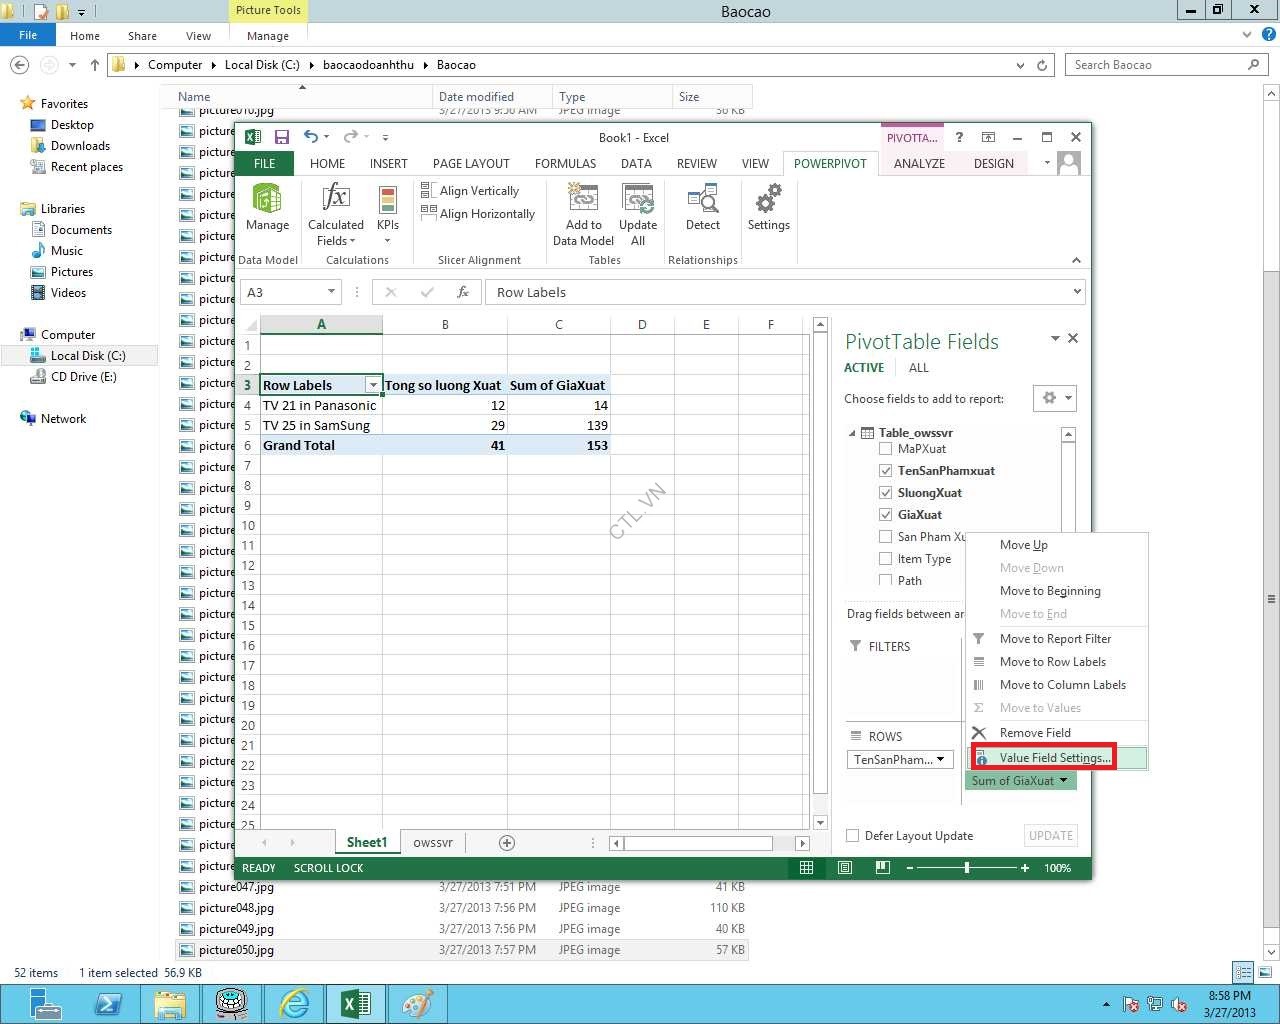
Sửa custom Name: Tong gia xuat Ok. Tương tự cho sum of so luong xuat sửa thành Tong so luong xuat Ok

B5. Tạo mục tiêu kinh doanh.
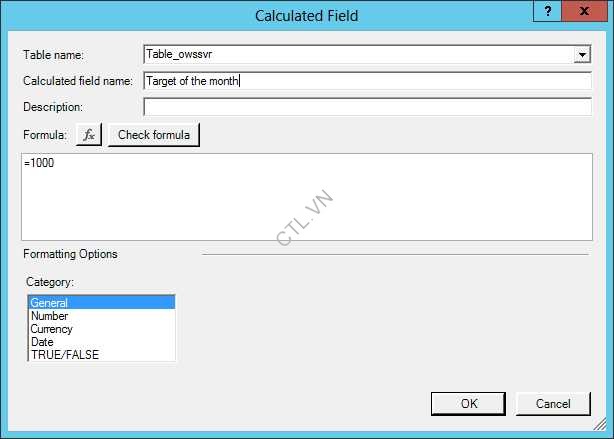
Chọn tab PowerPivot Calculated fields New calculated files
Nếu không có tab PowerPivot. Vào tab file chọn Option Add-Ins trong manage chọn COM add-ins ấn go, check vào Microsoft office PowerPivot for excel 2013 Ok

Calculated field name: target of the month, trong formula nhập vào mục tiêu =1000 (một tháng phải bán được 1000 sản phẩm) Ok
Tiếp tục chọn New Calculated Field

Calculated field name: Doanh thu thang = 4500000 Ok. Tạo mục tiêu xong

B6. Create Key Performance Indicators
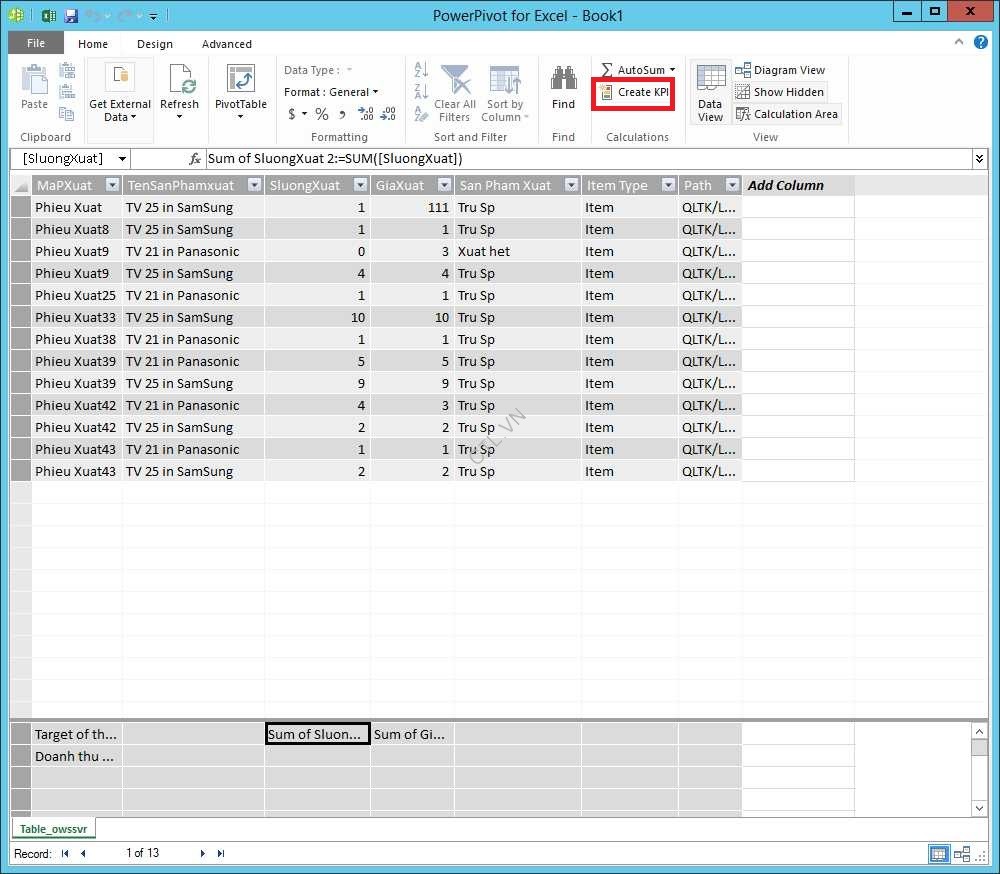
Tại tab PowerPivot chọn Manage

Đặt con trỏ bên dưới SluongXuat chọn Auto Sum

Tương tự đặt con trỏ bên dưới giaXuat chọn Auto Sum

Chọn Sum of sluong chọn Create KPI
Chọn option Calculated Field chọn Target of the month Ok
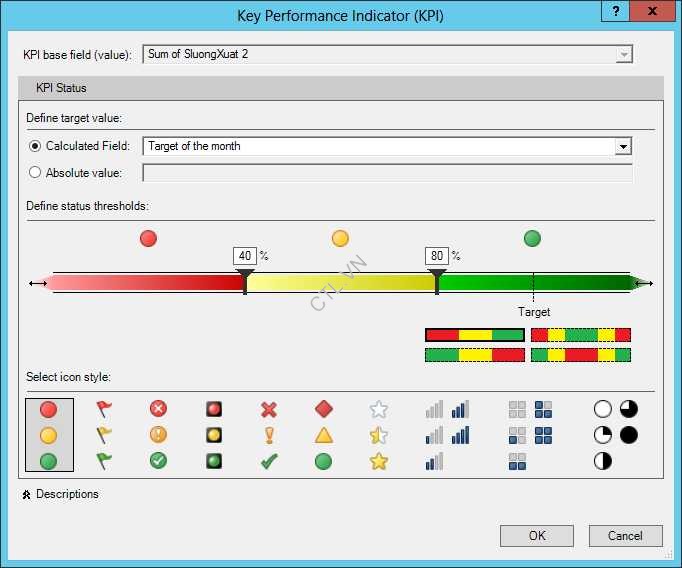
Tương tự chọn Sum of Giaxuat chọn Create KPI
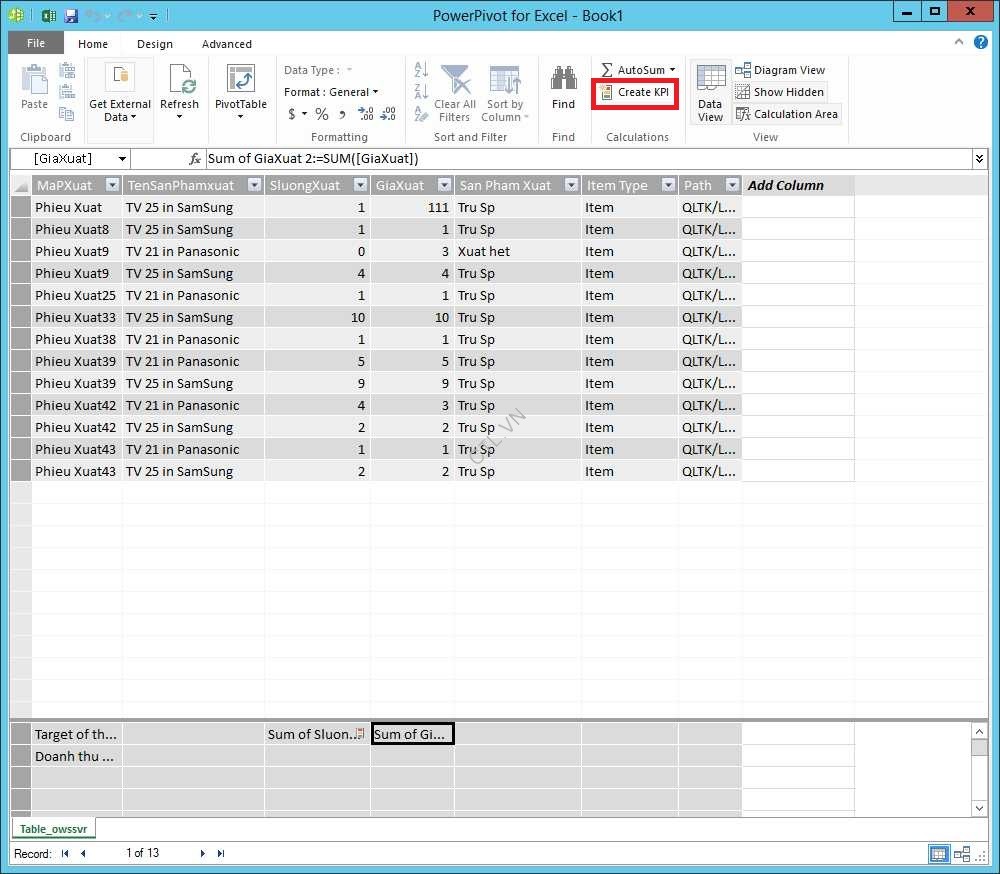
Chọn option Calculated Field chọn doanh thu tháng Ok

Trở lại Pivot table fields check status trong Sum of Giaxuat và sum of so luong sẽ xuất hiện status như trong hình. Tạo KPI xong

B7. Lưu báo cáo vào sharepoint
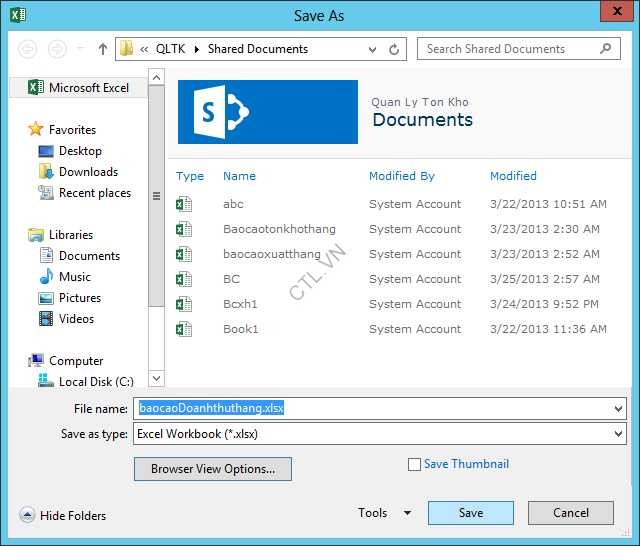
Vào tab file chọn save as sharepoint ấn Browse

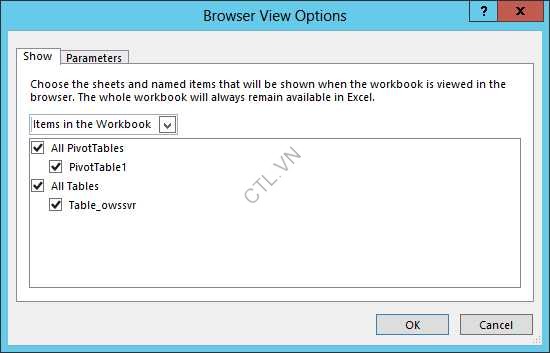
Lưu vào site http://internal.nhatnghe.local/QLTK/shared Ducuments, đặt tên file, ấn Browser view option
Chọn các checkbox như trong hình Ok Save. Lưu vào sharepoint xong
B8. Edit page( hiển thị báo cáo)
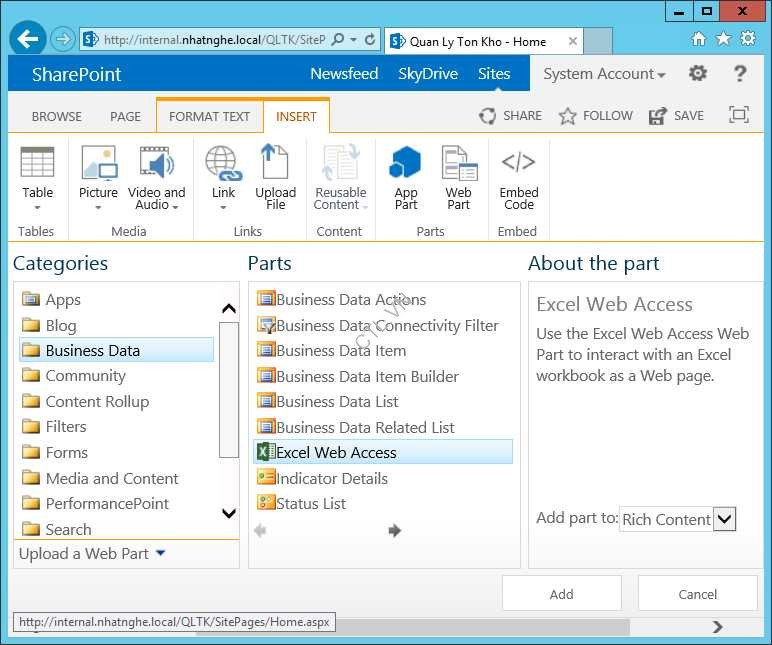
Trở về site QLTK chọn Page edit page, đặt con trỏ vào vị trí cần hiển thị và tab Insert chọn Web part
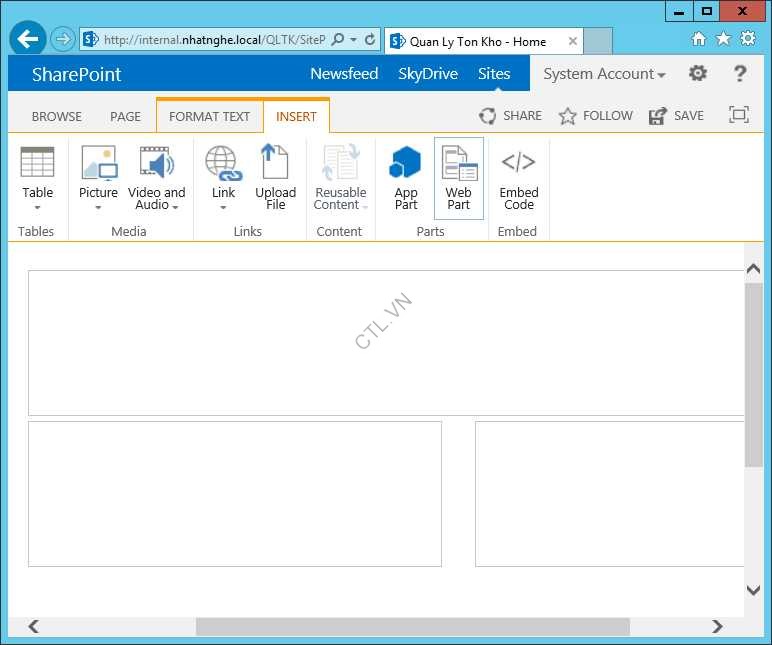
Chọn Business Data Excel web access add
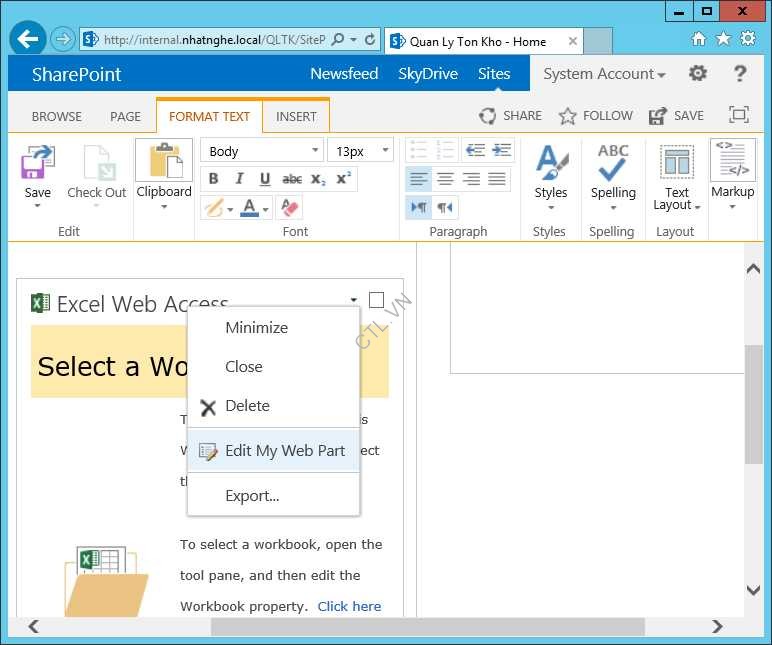
Chọn excel web access edit my web part
Trong phần workbook ấn …

Chọn file báo cáo doanh thu thang Insert

Name Item nhập vào PivotTable1
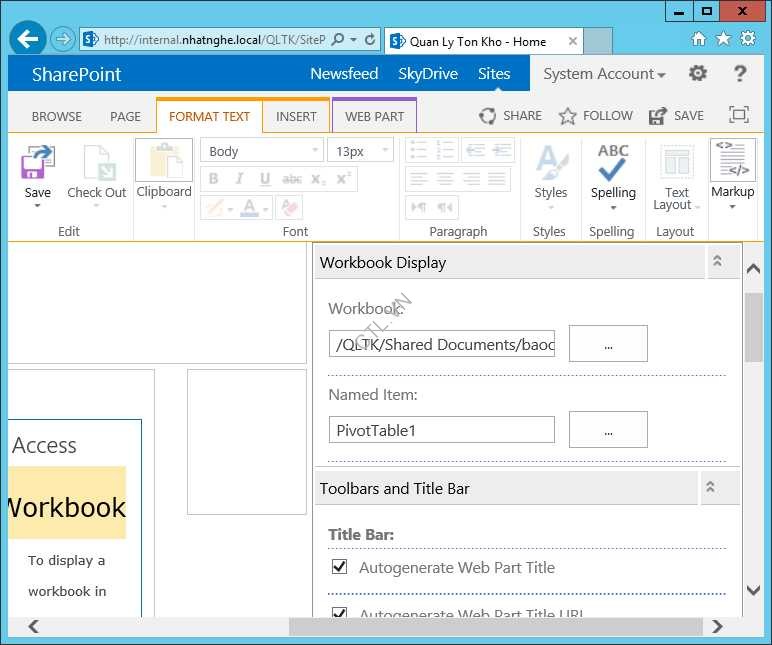
Trong Appearance, title: Báo cáo doanh thu Tháng OK

Thông tin đã được hiển thị Save. Hoàn tất. các bạn làm tương tự tạo KPI cho báo cáo kinh doanh ngày hiện tại, tuần hiện tại, năm hiện tại

Mr CTL – LABS.VNSEOLAB.COM